

How Common Is ADHD in Australia?
More than 800,000 Australians are estimated to have ADHD, around 281,200 children and adolescents and 533,300 adults. This is a modelled population estimate (Deloitte Access Economics, 2019), not a measured count, because Australia does not run a dedicated national ADHD prevalence survey. Internationally, pooled prevalence estimates commonly sit around 5 percent in children and roughly 2 to 3 percent in adults. Prevalence estimates and diagnosis rates are different measures and should not be compared directly.
How prevalent is ADHD, and how many people get ADHD in the first place? These statistics get quoted loosely and often without a date attached, which is how the same condition ends up described as affecting 2 percent of people in one article and 10 percent in another. Both figures can be defensible depending on the population, the age group, the diagnostic criteria used and the year.
Every figure on this page has its source and year attached. Where a number is contested or dated, that is stated rather than smoothed over.
Australian ADHD Prevalence: The Headline Numbers
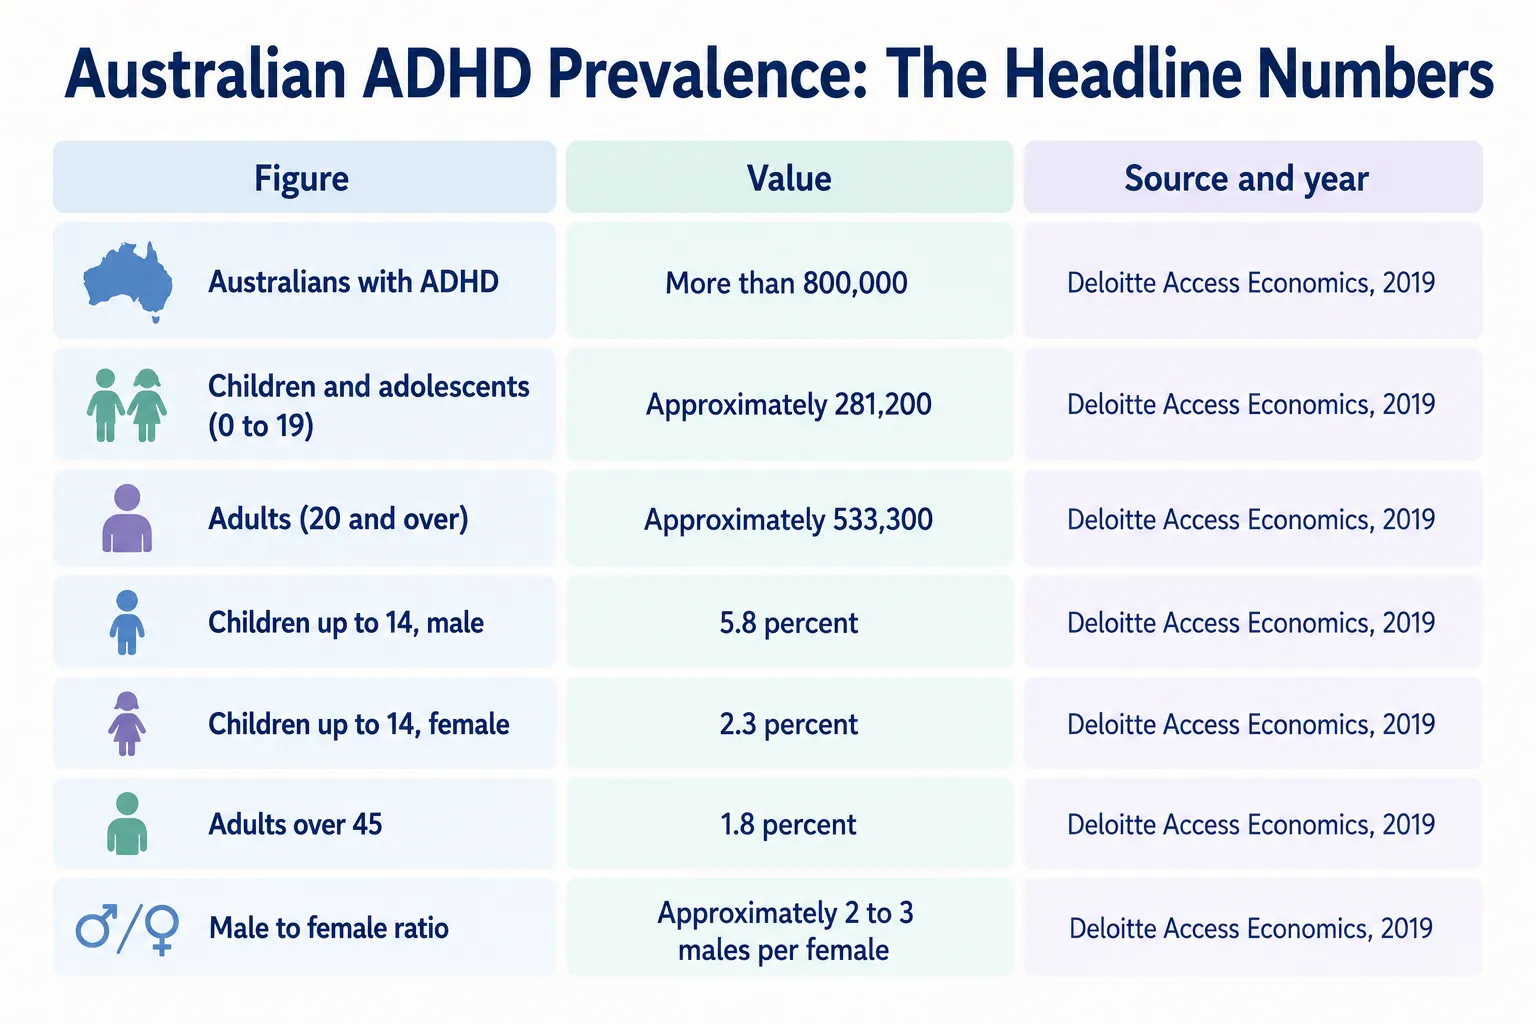
| Figure | Value | Source and year |
| Australians with ADHD | More than 800,000 | Deloitte Access Economics, 2019 |
| Children and adolescents (0 to 19) | Approximately 281,200 | Deloitte Access Economics, 2019 |
| Adults (20 and over) | Approximately 533,300 | Deloitte Access Economics, 2019 |
| Children up to 14, male | 5.8 percent | Deloitte Access Economics, 2019 |
| Children up to 14, female | 2.3 percent | Deloitte Access Economics, 2019 |
| Adults over 45 | 1.8 percent | Deloitte Access Economics, 2019 |
| Male to female ratio | Approximately 2 to 3 males per female | Deloitte Access Economics, 2019 |
These figures on the prevalence of ADHD in Australia come from The Social and Economic Costs of ADHD in Australia, prepared by Deloitte Access Economics for the Australasian ADHD Professionals Association and published in 2019, with the underlying analysis later published in the Journal of Attention Disorders (Sciberras et al., 2022). The prevalence figures were modelled using Global Burden of Disease 2017 data combined with Australian analysis, rather than measured through a national ADHD survey. It remains the most comprehensive Australian whole-of-population estimate available, and it is now several years old.
Children and Adolescents
The most frequently cited Australian survey figure comes from Young Minds Matter, the second Australian Child and Adolescent Survey of Mental Health and Wellbeing.
- ADHD was the most commonly reported disorder among children aged 4 to 11, at 8.2 percent (Australian Institute of Health and Welfare, based on Young Minds Matter, 2013 to 2014). This reflects survey-reported disorder using structured diagnostic interviews, not clinically confirmed diagnosis, and the survey is now more than a decade old.
- Prevalence in children up to 14 was estimated at 5.8 percent in males and 2.3 percent in females (Deloitte Access Economics, 2019).
Why these two figures differ
They measure different things. The survey figure reflects reported disorder in a specific age band using survey methodology. The Deloitte figure is a modelled population estimate across a wider age range. Neither is wrong; they answer different questions. The survey data is also now over a decade old, which is a genuine limitation.
Adults
Adults account for the majority of Australians with ADHD, which surprises people who think of it as a childhood condition.
- Approximately 533,300 Australian adults aged 20 and over were estimated to have ADHD (Deloitte Access Economics, 2019). That is roughly two thirds of the total.
- Prevalence declines with age, reaching an estimated 1.8 percent among adults over 45 (Deloitte Access Economics, 2019).
- Persistence into adulthood is reported in roughly 60 to 86 percent of individuals diagnosed in childhood, with estimates varying by how persistence is defined (May et al., Australian and New Zealand Journal of Psychiatry, 2023).
What Percentage of People Have ADHD?
There is no single number for the percentage of people with ADHD, and anyone quoting one without qualification is oversimplifying. The percentage of population with ADHD depends entirely on which population and which criteria are being used.
| Population | Commonly cited range | Note |
| Children, international estimates | Commonly around 5 percent in pooled estimates | Varies substantially by criteria, informant and country |
| Adults, international estimates | Roughly 2 to 3 percent | Lower than childhood figures, partly reflecting declining prevalence with age |
| Australian children up to 14 | 2.3 to 5.8 percent depending on sex | Deloitte Access Economics, 2019 |
| Australian adults over 45 | 1.8 percent | Deloitte Access Economics, 2019 |
The spread is not a sign that the research is unreliable. It reflects real methodological differences: whether DSM or ICD criteria were used, whether parents, teachers or the person themselves reported symptoms, whether functional impairment was required, and which age band was studied.
The Cost of ADHD in Australia
Deloitte Access Economics estimated the total social and economic cost of ADHD in Australia at 20.42 billion dollars for the 2018 to 2019 financial year. These figures have not been updated since, and are presented in 2018 to 2019 dollars.
| Component | Value |
| Total social and economic cost | $20.42 billion |
| Financial costs | $12.83 billion |
| Wellbeing losses | $7.59 billion |
| Productivity share of financial costs | 81 percent |
| Health system share of financial costs | 6 percent |
The distribution of who bears that cost is worth noting: employers were estimated to carry the largest share of financial costs at 39 percent, followed by governments at 30 percent, and individuals and their families at 20 percent (Deloitte Access Economics, 2019).
More Recent Australian Data
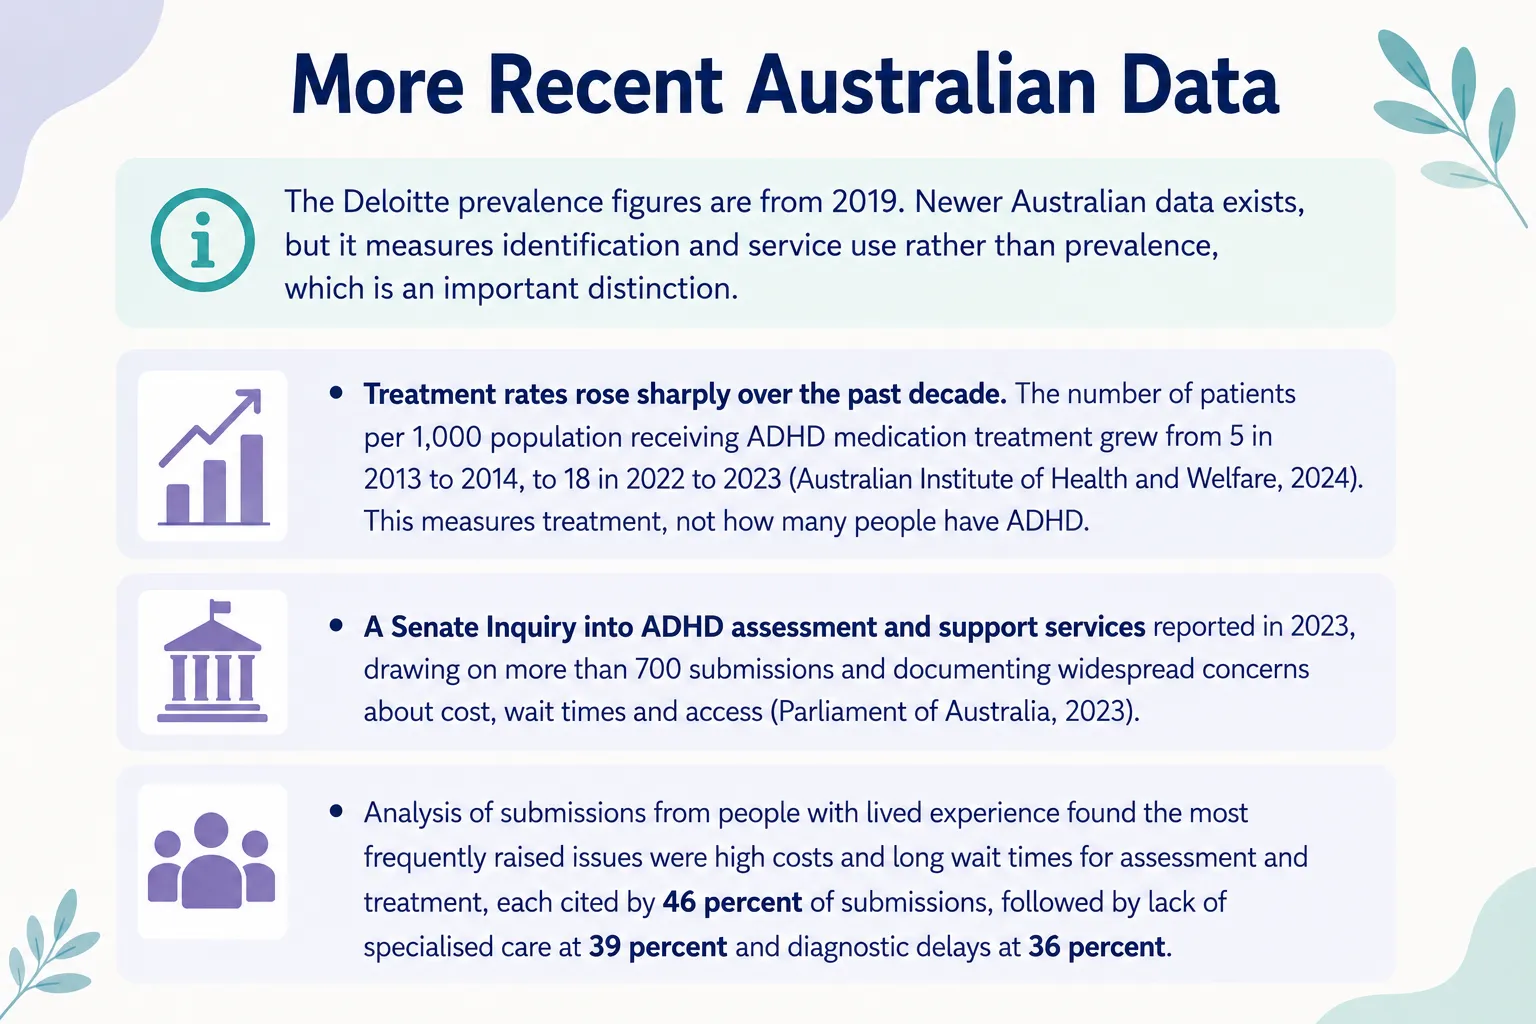
The Deloitte prevalence figures are from 2019. Newer Australian data exists, but it measures identification and service use rather than prevalence, which is an important distinction.
- Treatment rates rose sharply over the past decade. The number of patients per 1,000 population receiving ADHD medication treatment grew from 5 in 2013 to 2014, to 18 in 2022 to 2023 (Australian Institute of Health and Welfare, 2024). This measures treatment, not how many people have ADHD.
- A Senate Inquiry into ADHD assessment and support services reported in 2023, drawing on more than 700 submissions and documenting widespread concerns about cost, wait times and access (Parliament of Australia, 2023).
- Analysis of submissions from people with lived experience found the most frequently raised issues were high costs and long wait times for assessment and treatment, each cited by 46 percent of submissions, followed by lack of specialised care at 39 percent and diagnostic delays at 36 percent.
A fourfold rise in treatment rates does not mean a fourfold rise in prevalence. It indicates that far more people are being identified and treated than a decade ago, which is consistent with improved recognition rather than a change in how many people have the condition.
How to Read ADHD Statistics
Four distinctions explain most of the confusion in this area.
Prevalence is not the same as diagnosis rate
Prevalence estimates how many people have the condition. Diagnosis rates count how many have been identified. The gap between them reflects access to assessment, awareness and clinical practice, not the underlying rate.
Rising diagnosis does not establish rising prevalence
Australian adult diagnosis rates have risen over the past decade. Possible explanations include improved recognition of presentations historically missed, changes in clinical practice, and increased public awareness. Diagnosis data alone cannot distinguish between these.
Regional variation often reflects access
Differences in diagnosis rates between regions frequently track the availability of psychiatrists and paediatricians more closely than any plausible difference in underlying prevalence.
Sex ratios differ by setting
Clinically referred samples show a higher male to female ratio than community samples do. Australia’s clinical guideline notes that girls and women are at risk of under-recognition, particularly where symptoms are predominantly inattentive (Australian ADHD Professionals Association, 2022). Diagnosed prevalence and true prevalence are not the same thing, and the size of any real difference in underlying rates remains uncertain.
Does Everyone Have ADHD?
No. Depending on the estimate used, ADHD affects somewhere between roughly 2 and 8 percent of the population, which means the large majority of people do not have it.
The impression that everyone has it comes from two things. Traits associated with ADHD, such as distractibility, disorganisation and restlessness, are experienced by almost everyone at times. And ADHD content is heavily represented on social media, which makes the condition feel far more prevalent than the data indicates. Diagnosis requires a long-standing pattern present since childhood, appearing across more than one setting, and causing functional impairment. Recognising individual traits does not meet that threshold.
Limitations of the Available Data
- The main Australian population estimate dates from 2019 and uses modelling based on global burden of disease data rather than a direct national ADHD survey.
- The most recent national child mental health survey data is from 2013 to 2014, which is more than a decade old.
- Australia does not maintain an ongoing national ADHD prevalence register, so figures are periodically modelled rather than continuously measured. Newer national data tracks treatment and service use rather than prevalence.
- International comparisons are complicated by differences in diagnostic criteria between DSM and ICD systems.
This page is reviewed every six months. Where newer Australian data becomes available, figures here will be updated and the previous source noted.
Related Guides
- ADHD in Australia: the complete guide
- What Is ADHD? Meaning, definition and full form
- ADHD symptoms in adults: the complete Australian guide
- ADHD in women and girls: why it presents differently
- Is ADHD a disability, a disorder or a difference?
References
- Deloitte Access Economics. The Social and Economic Costs of ADHD in Australia. Prepared for the Australasian ADHD Professionals Association, 2019. deloitte.com
- Sciberras E, Streatfeild J, Ceccato T, Pezzullo L, et al. Social and Economic Costs of Attention-Deficit/Hyperactivity Disorder Across the Lifespan. Journal of Attention Disorders. 2022;26(1):72–87. doi:10.1177/1087054720961828
- Australian Institute of Health and Welfare. Australia’s children: children with mental illness. Based on Young Minds Matter, the second Australian Child and Adolescent Survey of Mental Health and Wellbeing, 2013 to 2014. aihw.gov.au
- Parliament of Australia, Senate Community Affairs References Committee. Assessment and support services for people with ADHD. 2023. aph.gov.au
- Australian Institute of Health and Welfare. ADHD medications dispensed over time. Mental health prescriptions, 2024. aihw.gov.au
- May T, et al. The Australian evidence-based clinical practice guideline for attention deficit hyperactivity disorder. Australian and New Zealand Journal of Psychiatry. 2023. doi:10.1177/00048674231166329
- Australian ADHD Professionals Association. Australian Evidence-Based Clinical Practice Guideline for Attention Deficit Hyperactivity Disorder (ADHD). Released October 2022. adhdguideline.aadpa.com.au
Last review: September 2026. Next scheduled review: September 2027. This article is general information and is not a substitute for individual medical advice, assessment or diagnosis.